Adrien Foucart\(^1\)
and Arthur Elskens\(^1\) and Christine
Decaestecker\(^1\)\(^2\)1
1- Université Libre de Bruxelles - Laboratory of Image Synthesis and
Analysis
Av. FD Roosevelt 50, Brussels - Belgium
2- Université Libre de Bruxelles - DIAPath
Center for Microscopy and Molecular Imaging
Rue Adrienne Bolland 8, Gosselies - Belgium
This is an annotated version of the published manuscript.
Annotations are set as sidenotes, and were not peer reviewed (nor reviewed by all authors) and should not be considered as part of the publication itself. They are merely a way for me to provide some additional context, or mark links to other publications or later results. If you want to cite this article, please refer to the official version linked with the DOI.
Adrien Foucart
Abstract
Evaluating algorithms (particularly in the context of a
competition) typically ends with a ranking from best to worst. While
this ranking is sometimes accompanied by statistical significance tests
on the assessment metrics, sometimes associated with confidence
intervals, the ranks are usually presented as singular values. We argue
that these ranks should themselves be accompanied by confidence
intervals. We investigate different methods for computing such
intervals, and measure their behaviour in simulated scenarios. Our
results show that we can obtain robust confidence intervals for ranks
using the Iman-Davenport test and the pairwise Wilcoxon signed-rank test
with Holm’s correction.
Introduction
Ranking a set of algorithms based on their ability to solve a task is
a very common part of machine learning research
: this is the "big table of results" with "ours" in bold that basically every comparative study offers. --AF
. This can be done in the
context of a competition (where a winner is declared), or in a
comparative study, where a proposed new method is measured against
previous work. This ranking almost always uses the mean value of an
assessment metric measured on a set of \(n\) test cases. This implicitly assumes
that the ranking on the set of test cases is equivalent to a ranking on
the population of all potential cases from which the test cases were
sampled, and contributes to known robustness problems [1].
In addition, it is established that everything from the choice of
metric [2], [3] to the uncertainty in the ground
truth [4] can
affect the rankings and perceived results of competitions [1], [5]. However, ranking methods are still
widely used and rarely questioned. At best, some statistical
significance tests are presented to support the significance of the
results, but the rankings themselves are presented as the end result of
the study.
This study is motivated by all these uncertainties inherent in the
ranking of algorithms. It aims to compare different methods for
computing confidence intervals (CI) for ranks, using Monte Carlo
simulations on synthetic data to measure the power (i.e. ability to
detect existing differences) and Type I error rate (i.e. false detection
of differences that don’t exist) of these methods. Based on the results,
we introduce cirank, a confidence ranking Python library2 that proposes several methods to
compute CI for ranks based on a set of results. Supplementary materials
are available at https://esann25.adfoucart.be/
: there are really lots of things in the supplementary materials, as ESANN's page limit is very restrictive! --AF
.
Related works
A general procedure for computing CI for ranks was proposed in 2013
by Holm [6]. Its
principle is straightforward: comparing \(m\) groups and using a statistical
significance test \(T\) for pairwise
comparisons, the CI for the rank of a group \(g\) is set as: \[\begin{gathered}
\left[ 1 + \#_{sbg}, m - \#_{swg} \right] \text{ with } sbg/swg \text{ for significantly better/worse groups} \\
\text{ and } \# \text{ for their number.}
\end{gathered}\]
This idea was used by Al Mohamad et al. [7] in the context of ranking
institutions, using Tukey’s Honestly Significant Difference (HSD)
test [8]. In the same context, Zhang et al.
proposed a Monte-Carlo method for estimating the CI for ranks [9], where the observed values are used
to generate bootstrapped samples on which the rankings can be computed,
resulting in a distribution of ranks where the percentiles can be used
to compute the CI.
Statistical tests for comparing algorithms based on an assessment
metric have been extensively studied, with some debate about which ones
should be used. Demšar argued in 2006 [10] for the use of the Iman-Davenport
(ID) modification of the Friedman test [11], with a Nemenyi post-hoc for
pairwise tests. Benavoli et al. have since argued [12] that the Nemenyi post-hoc is
problematic in this case as the result on a pair is influenced also by
the ranks of the other algorithms (i.e. if we add or remove an
algorithm, all pairwise comparisons may be affected).
Their recommendation of using Wilcoxon signed-rank tests [13] (with a correction for family-wise
error such as Holm’s correction [14]) are followed by Wiesenfarth et
al. [15] in their open-source toolkit for
analyzing and visualizing challenge results. Wiesenfarth et al. also
propose a bootstrapping method for estimating CI for ranks. This method,
however, is documented as a way of assessing ranking stability and not
as an actual outcome of the study (as in: this can supplement the
discrete ranking in a discussion, but it doesn’t replace it). Another
argument against using Friedman’s test comes from Zimmerman and
Zumbo [16], who argue that as a multi-sample
extension of the sign test (rather than the Wilcoxon
signed-rank test, as it is sometimes presented), Friedman’s test lacks
statistical power. They propose to instead use a rank-transformation
procedure such as proposed by Conover and Iman [17], and then to perform a
repeated-measures ANOVA on the ranks as a more powerful alternative.
In this work, we put these ideas together and test several options
for building a CI for ranks based on Holm’s procedure, using statistical
tests appropriate for comparing algorithms.
Methods and materials
Methods for computing CI for
ranks
Let us assume that \(S_{ij}\) is the
score of algorithm \(i\) on test case
\(j\) and is numerical or, at
least, ordinal. This would be the case for instance in any
regression tasks, or in registration (e.g. RMSE) or segmentation
problems (e.g. IoU) in image analysis. We need to make the following
assumptions about the test dataset \(\mathcal{D}\) and assessment metric \(M\): (a) \(\mathcal{D}\) is a random sampling of the
population of "possible test cases" (all cases that could potentially be
seen by the algorithm); (b) the algorithms are independent from
each other; (c) the metric\(M\) is representative of the capability of
the algorithm to perform the task in a monotonically increasing or
decreasing sense and (d) the annotation \(Y_j\) provide a reliable ground truth.
While these assumptions are typically not verified in real-world
competitions [5], we consider here that addressing
the violations of these assumptions is outside of the scope of the
statistical analysis of the results, but rather something that should be
discussed as a limitation on the validity of the competition’s or
study’s design.
Five methods for calculating confidence interval on ranks are
considered: a bootstrapping method (as proposed in [15]), and four methods based on
multi-sample statistical tests: ID with Nemenyi post hoc, ID with
two-sided Wilcoxon pairwise tests and adjusted p-values [14], the same with one-sided pairwise
tests, and ANOVA on ranks with Tukey’s HSD post hoc. If the result of
the family-wise test (ID or ANOVA) is not significant, the ranks are set
as \([1, m]\) for all algorithms.
Otherwise, we use Holm’s procedure as outlined above.
Details on the mathematical formulation and the implementation of the
tests are presented as supplementary materials
: see here --AF
.
Dataset
We base our experiments on synthetically generated data. Score
distributions are paired (measured on the same samples). We used
publicly available results from the grand-challenge.org website to
determine a simple but realistic shape for these distributions. Based on
our analysis (see supplementary materials
: see here --AF
), we determined that score
distributions are usually asymmetrical, often with a sharp peak and a
long tail, and sometimes a few outliers. We therefore use a Laplace
asymmetric distribution \(L\) to act as
a per-case difficulty, so that for a sample of size \(n\) we get a distribution of difficulty
\(\{d_j\}_{j=1}^n\) with \(d_j \sim L\). Each algorithm \(A_i\) is then associated with a normal
distribution \(N_i(\mu_i, \sigma_N)\),
so that the score of algorithm \(i\) on case \(j\) is generated as \(s_{ij} = d_{j} + n_{ij}\), with \(n_{ij} \sim N_i\). The mean of \(N_i\) therefore acts as a “bias" to push
the algorithm to higher or lower scores, and the variance of \(N_i\) acts as a “reliability" factor,
making the algorithm more or less likely to act erratically. A null
hypothesis scenario of equal algorithm performance is made by
giving equal means to the \(N_i\). This
allows us to verify that the significance level of the different tests
is correctly met. By increasing the difference between the means, we can
create scenarios with performance differentials, and therefore compute
the power of the different tests to correctly influence the CI for
algorithm ranks
: examples of generated results can be found here --AF
.
Monte Carlo simulation
and evaluation
For each scenario, we use repetitions with different random seeds
until the measure of interest has converged. All scenarios have \(\kappa=2\) for the Laplace asymmetric
distribution.
First, we test the family-wise Type I error (FWTI) for
all ranking methods, defined here as the ratio of simulations where the
ranking is different than \([1, m]\)
for at least one algorithm under null hypothesis conditions (same mean
for all \(N_i\)). We use
m=5 and m=10 algorithms to test the impact of
the number of algorithms, and n=20 or n=40 to
test the impact of the sample size. To be acceptable, a ranking method
should keep a FWTI\(<
\alpha\), the significance level of the tests. We then gradually
increase \(\delta\), the difference
between the means of the successive \(N_i\) (so that the means are \([0, \delta, 2\delta, \ldots,
(m-1)\delta]\)).
We use \(\delta = \{\frac{\sigma_N}{4},
\frac{\sigma_N}{2}, \sigma_N, 2\sigma_N\}\), and we measure the
family-wise power (FWP) in the same way as the
FWTI. We also measure the individual power
(IP) as the ratio of pairwise tests that are significant at
our chosen \(\alpha\), the distinctive
power (DP) as the average frequency that an algorithm has a
distinct \([i, i]\) confidence interval
(i.e. is completely disjoint from all others, with all pairwise p-values
\(<\alpha\)), and the family-wise
distinctive power (FWDP) as the frequency that all
algorithms have distinct \([i,
i]\) (i.e. the CI are \([1, 1], [2,
2]\ldots [m, m]\))
: to clarify the differences between these power measures: FWDP is the strictest definition of "power", as it requires all pairwise tests to be significant to pass; DP can still be high as long as most algorithms have distincts CI; IP just looks at pairwise tests and can still be high even if most algorithms have e.g. CIs like \([k, k+1]\). FWP is the easiest to get, as it only requires the family-wise null hypothesis of "all algorithms equal" to be rejected.. --AF
.
We set \(\alpha = 0.05\) as a
significance level for all tests. Each simulation is run 5000 times or
until all measures have converged.
Results
We summarize in this section the main results. Full tables of results
for all experiments are available in supplementary materials
: see here --AF
. The main
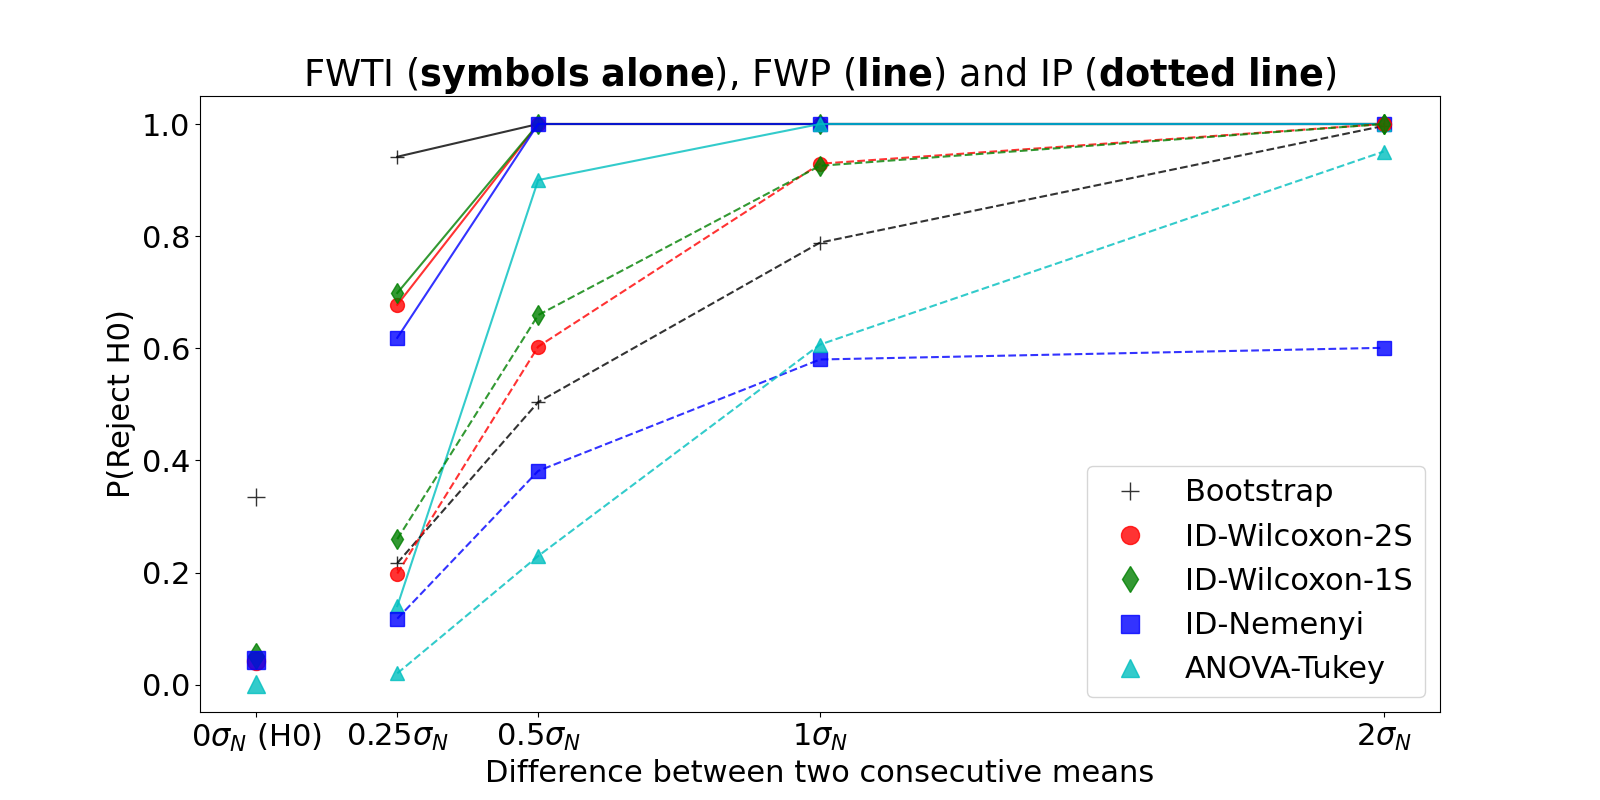
results for FWTI, FWP and IP are
shown in Fig. 1 for m=5, n=20. The
bootstrapping method has a very large FWTI error, which
increases greatly with the number of algorithms (around \(30\%\) for m=5, up to more
than \(90\%\) for m=10).
All other methods remain below the \(5\%\) target, with ANOVA-Tukey \(<1\%\) and all other tests around \(3\)-\(5\%\) for all m,n combinations
tested.
In terms of FWP, Fig. 1 shows that
ANOVA-Tukey is less powerful than the ID-based methods (Wilcoxon or
Nemenyi variants, which are essentially identical with Wilcoxon slightly
more powerful at lower separation levels).
For the IP, the two Wilcoxon methods are more powerful
than Nemenyi and ANOVA-Tukey. The DP and FWDP
(not shown in Fig. 1) show similar trends, with
ID-Nemenyi stuck at \(0\%\) even if we
increase the separation massively (theoretical computations in
supplementary materials show that it needs much larger sample sizes to
achieve FWDP\(>0\)).
The one-sided Wilcoxon test is slightly more powerful in terms of
FWP, IP, DP and FWDP
than the two-sided version at low separation levels while keeping a
similar FWTI error, but the difference is small. While we
would expect the one-sided test to be much more powerful than the
two-sided test, the difference in the pairwise p-values is compensated
by Holm’s correction, which impacts both versions differently (more
details in supplementary materials
: see here --AF
).
FWTI, FWP and IP for
different ranking methods for m=5 and n=20 at
\(\alpha=0.05\). \(\sigma_N\) on the graph is the standard
deviation of the \(N_i\) distributions
used to compute the scores of the algorithms, so that \(1\sigma_N\) signifies that the means of
\(N_i\) and \(N_{i+1}\) will be separated by one standard
deviation. 1S and 2S: one- and two-sided.
Conclusions
The best option among those tested here for computing confidence
intervals for algorithm ranks when the per-case metric is numerical is
to use the Iman-Davenport multisample test and, if its null hypothesis
is rejected, to compute pairwise one-sided Wilcoxon signed-rank tests,
adjusting the p-values with Holm’s procedure. Then, the ranking for each
algorithm is \[[ 1 + \#_{sba}, m - \#_{swa}]
\text{ with } sba/swa \text{ for significantly better/worse
algorithm}\] If the ID test does not reject the null hypothesis,
the CI should be \([1, m]\) for all
algorithm ranks. Using this procedure to replace simple rankings in
comparative studies of algorithms makes the interpretation of the
results easier: all algorithms that have \(1\) in their CI are reasonably likely to be
“the best", all algorithms that have overlapping CI cannot be
conclusively ranked. Bootstrapping methods should be avoided for this
purpose as they are too sensitive to non-significant differences in the
sample distribution.
Future work will expand these analyses to different types of result
distributions, and to categorical dependent variables (e.g. for
classification tasks
: this should be reasonably straightfoward: in classification tasks, the per-case metric would be binary ("success" or "failure"), and Cochrane's Q test with McNemar pairwise tests as post-hoc should give good results. --AF
). In particular, the Wilcoxon test assumes that the
distribution of differences is symmetrical, which is the case in our
simulations but is not necessarily verified in real results.
[1]
L.
Maier-Hein et al., “Why rankings of biomedical image
analysis competitions should be interpreted with care,”Nature Communications, vol. 9, no. 1, p. 5217, Dec. 2018, doi:
10.1038/s41467-018-07619-7.
[2]
A.
Reinke et al., “Common Limitations of
Image Processing Metrics: A Picture
Story,”arXiv: 2104.05642, pp. 1–11, Apr. 2021,
Available: https://arxiv.org/abs/2104.05642
[3]
A.
Foucart, O. Debeir, and C. Decaestecker, “Panoptic quality should
be avoided as a metric for assessing cell nuclei segmentation and
classification in digital pathology,”Scientific
Reports, vol. 13, no. 1, p. 8614, May 2023, doi: 10.1038/s41598-023-35605-7.
[4]
A.
Foucart, O. Debeir, and C. Decaestecker, “Processing multi-expert
annotations in digital pathology: A study of the Gleason
2019 challenge,” in 17th International Symposium
on Medical Information Processing and
Analysis, A. Walker and others, Eds., SPIE, Dec. 2021,
p. 4. doi: 10.1117/12.2604307.
[5]
A.
Foucart, O. Debeir, and C. Decaestecker, “Shortcomings and areas
for improvement in digital pathology image segmentation
challenges,”Computerized Medical Imaging and Graphics,
p. 102155, Dec. 2022, doi: 10.1016/j.compmedimag.2022.102155.
D.
Al Mohamad, J. Goeman, and E. Van Zwet, “Simultaneous confidence
intervals for ranks with application to ranking institutions,”Biometrics, vol. 78, no. 1, pp. 238–247, Mar. 2022, doi: 10.1111/biom.13419.
[8]
J.
Tukey, “Comparing Individual Means in the
Analysis of Variance,”Biometrics, vol. 5, no. 2, p. 99, Jun. 1949, doi: 10.2307/3001913.
[9]
S.
Zhang et al., “Confidence intervals for ranks of
age-adjusted rates across states or counties,”Statistics in
Medicine, vol. 33, no. 11, pp. 1853–1866, May 2014, doi: 10.1002/sim.6071.
[10]
J.
Demšar, “Statistical comparisons of classifiers over multiple data
sets,”The Journal of Machine Learning Research, vol. 7,
pp. 1–30, 2006.
[11]
R.
Iman and J. Davenport, “Approximations of the critical region of
the Friedman statistic,”Communications in
Statistics - Theory and Methods, vol. 9, no. 6, pp. 571–595, Jan.
1980, doi: 10.1080/03610928008827904.
[12]
A.
Benavoli, G. Corani, and F. Mangili, “Should we really use
post-hoc tests based on mean-ranks?”The Journal of Machine
Learning Research, vol. 17, no. 1, pp. 152–161, 2016.
[13]
F.
Wilcoxon, “Individual Comparisons by Ranking
Methods,”Biometrics Bulletin, vol. 1, no. 6, p.
80, Dec. 1945, doi: 10.2307/3001968.
[14]
S.
Holm, “A Simple Sequentially Rejective Multiple Test
Procedure,”Scandinavian Journal of Statistics,
vol. 6, no. 2, pp. 65–70, 1979, Available: https://www.jstor.org/stable/4615733
[15]
M.
Wiesenfarth et al., “Methods and open-source toolkit for
analyzing and visualizing challenge results,”Scientific
Reports, vol. 11, no. 1, p. 2369, Jan. 2021, doi: 10.1038/s41598-021-82017-6.
[16]
D.
Zimmerman and B. Zumbo, “Relative Power of the
Wilcoxon Test, the Friedman Test, and
Repeated-Measures ANOVA on Ranks,”The Journal of Experimental Education, vol. 62, no. 1, pp.
75–86, Jul. 1993, doi: 10.1080/00220973.1993.9943832.
[17]
W.
Conover and R. Iman, “Rank Transformations as a
Bridge between Parametric and
Nonparametric Statistics,”The American
Statistician, vol. 35, no. 3, pp. 124–129, Aug. 1981, doi: 10.1080/00031305.1981.10479327.
This research was supported by the Walloon Region
(Belgium) in the framework of the Prother-wal program (grant No. 7289).
CD is a senior research associate with the F.R.S.-FNRS and an active
member of the TRAIL Institute (Trusted AI Labs, https://trail.ac/,
Fédération Wallonie-Bruxelles, Belgium). CMMI is supported by the
European Regional Development Fund and the Walloon Region
(Walloniabiomed, #411132-957270, project “CMMI-ULB”).↩︎