[Devlog] Coordinates and scale
Adrien Foucart, PhD in biomedical engineering.
This website is guaranteed 100% human-written, ad-free and tracker-free. Follow updates using the RSS Feed or by following me on Mastodon
Adrien Foucart, PhD in biomedical engineering.
This website is guaranteed 100% human-written, ad-free and tracker-free. Follow updates using the RSS Feed or by following me on Mastodon
When working with digital pathology images, particularly in a context where we have to use multiple libraries, compare to different modalities, and work at different scale, it’s very easy to get lost in the coordinates systems. It’s (for me at least) an extremely common source of error in my code, where I mix my axes or screw up in some way the indexing of the region I’m trying to adress.
Let’s take a quick example to see what I mean. To open whole-slide images (WSI), I use the Openslide library:
import openslide

slide = openslide.OpenSlide("path/to/slide.ndpi")
These WSI are multi-scale, meaning that they have been scanned at different levels of magnifications in the microscope. From the OpenSlide object, we can get information about the available levels, magnification, and corresponding resolution.
max_mag = float(slide.properties[openslide.PROPERTY_NAME_OBJECTIVE_POWER])
mpp_x = float(slide.properties[openslide.PROPERTY_NAME_MPP_X])
mpp_y = float(slide.properties[openslide.PROPERTY_NAME_MPP_Y])

print(f"Maximum magnification: {max_mag}x")
print(f"Maximum resolution: {mpp_x:.2f}x{mpp_y:.2f}µm/px")
print(f"Number of levels: {slide.level_count}")
for level in range(slide.level_count):
    print(f"[{level}] {slide.level_dimensions[level]}px\t" +
          f"@{max_mag/slide.level_downsamples[level]:.2f}x\t" +
          f"{mpp_x*slide.level_downsamples[level]:.2f}x{mpp_y*slide.level_downsamples[level]:.2f}µm/px (" +
          f"downsample={slide.level_downsamples[level]})")
Maximum magnification: 20.0x
Maximum resolution: 0.46x0.46µm/px
Number of levels: 8
[0] (76800, 38016)px @20.00x 0.46x0.46µm/px (downsample=1.0)
[1] (38400, 19008)px @10.00x 0.92x0.92µm/px (downsample=2.0)
[2] (19200, 9504)px @5.00x 1.84x1.84µm/px (downsample=4.0)
[3] (9600, 4752)px @2.50x 3.67x3.67µm/px (downsample=8.0)
[4] (4800, 2376)px @1.25x 7.35x7.35µm/px (downsample=16.0)
[5] (2400, 1188)px @0.62x 14.69x14.69µm/px (downsample=32.0)
[6] (1200, 594)px @0.31x 29.38x29.38µm/px (downsample=64.0)
[7] (600, 297)px @0.16x 58.76x58.77µm/px (downsample=128.0)At this point, we have not yet accessed the image data. If we want to do that, we need to call the read_region method, which takes as input three parameters: the location (of the top-left corner), the level and the dimensions. Here, we get a first common source of error, which is that the location needs to be expressed in “pixels at the highest available resolutions” (i.e. level 0), while the dimension is expressed at the target level. In both cases, the convention used for the axis order is (x, y), with x being the “width” direction and y the “height”.
So, let’s first look at the whole image at the lowest level of magnification:
from matplotlib import pyplot as plt
%matplotlib inline

im_low = slide.read_region((0, 0), 7, (600, 297))

plt.figure()
plt.imshow(im_low)
plt.show()
Now if we want to look more specifically at the tissue region on the left at a higher magnification (say, 1.25x, corresponding to “level 4” in this image), we have some computations to do. We can easily determine good coordinates and dimensions at the level that we’re currently looking at. Something like (10, 130) for the top-left corner, (120, 150) for the dimensions should work. But we need to convert those values to the right coordinates systems. For the location, it’s the highest available resolution, which is 128x higher than the one we were looking at.
So we need:
location = (10*128, 130*128)And for the dimensions, we need to look at level 4, which is 8x more magnification than the current view, so we need:
dimensions = (120*8, 150*8)Let’s check if our math was correct:
tissue_region = slide.read_region(location, 4, dimensions)

plt.figure()
plt.imshow(tissue_region)
plt.show()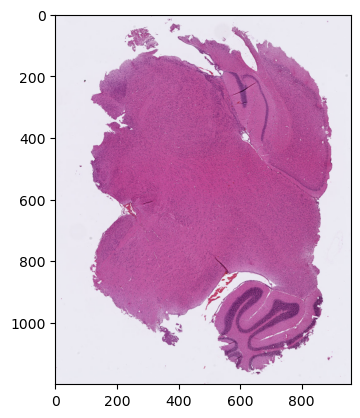
Perfect… but as you can see, it requires some thinking to make sure we get the correct region. And it gets worse. Because read_region returns an Image object from the PIL library, but very often when we do some actual processing (or to display it like we just did with matplotlib) we want to have access directly to the pixel data, which we will typically store in a numpy array. The conversion is easily done, but we can see something interesting when we print the shape of this array:
import numpy as np
tissue_region_array = np.array(tissue_region)
print(tissue_region_array.shape)
(1200, 960, 4)The dimensions are now expressed with a different convention: the first axis is the “rows” (or height), the second the “columns” (width), and then we have 4 channels, as the image has been opened as an RGBA image, with an Alpha channel. So if we want to adress a region in this array, we have to use a (y, x) convention instead of (x, y).
That’s not all. For registration tasks, a very useful library is SimpleITK. Which has, of course, its own image format, which can cause some trouble if we’re not careful:
import SimpleITK as sitk

tissue_region_sitk = sitk.GetImageFromArray(tissue_region_array)
print(tissue_region_sitk.GetSize())
print(tissue_region_sitk.GetWidth(), tissue_region_sitk.GetHeight(), tissue_region_sitk.GetDepth())
(4, 960, 1200)
4 960 1200As we can see here, the method to read an image from a numpy array interpreted the numpy dimensions as (depth, height, width), which is not ideal if we want to process the image in SimpleITK… If we want SimpleITK to give the expected results, we need to specify that the pixel values are vectors (here, RGBA vectors):
tissue_region_sitk = sitk.GetImageFromArray(tissue_region_array, isVector=True)
print(tissue_region_sitk.GetSize())
print(tissue_region_sitk.GetWidth(), tissue_region_sitk.GetHeight(), tissue_region_sitk.GetDepth())
(960, 1200)
960 1200 0And we are back to the (x, y) convention, like PIL. So if we want to access the same pixel in the three representations of the tissue region, we have:
px_pil = tissue_region.getpixel((400, 300))
px_np = tissue_region_array[300, 400]
px_sitk = tissue_region_sitk.GetPixel(400, 300)
print(px_pil)
print(px_np)
print(px_sitk)
(181, 84, 151, 255)
[181 84 151 255]
(181, 84, 151, 255)Another interesting observation is that, in sitk, we can bring back some information about the location and the “real-world” resolution of the image, informations that are completely lost in the PIL and Numpy representations. With the “Origin” and “Spacing”, we can put the image into a world representation. Let’s do it here using µm for our dimensions.
tissue_region_sitk.SetOrigin((10*128*mpp_x, 130*128*mpp_y)) # offset in µm from the top-left corner of the image
tissue_region_sitk.SetSpacing((16*mpp_x, 16*mpp_y)) # resolution in µm at the level 4 (which is 16x downsampled from the maximum)
And we can see that all these informations are contained into the sitk.Image object.
print(tissue_region_sitk)VectorImage (0000028FFFD0E2E0)
RTTI typeinfo: class itk::VectorImage<unsigned char,2>
Reference Count: 1
Modified Time: 1676
Debug: Off
Object Name:
Observers:
none
Source: (none)
Source output name: (none)
Release Data: Off
Data Released: False
Global Release Data: Off
PipelineMTime: 0
UpdateMTime: 0
RealTimeStamp: 0 seconds
LargestPossibleRegion:
Dimension: 2
Index: [0, 0]
Size: [960, 1200]
BufferedRegion:
Dimension: 2
Index: [0, 0]
Size: [960, 1200]
RequestedRegion:
Dimension: 2
Index: [0, 0]
Size: [960, 1200]
Spacing: [7.34518, 7.34585]
Origin: [587.614, 7639.69]
Direction:
1 0
0 1
IndexToPointMatrix:
7.34518 0
0 7.34585
PointToIndexMatrix:
0.136144 0
0 0.136131
Inverse Direction:
1 0
0 1
VectorLength: 4
PixelContainer:
ImportImageContainer (0000028F825273F0)
RTTI typeinfo: class itk::ImportImageContainer<unsigned __int64,unsigned char>
Reference Count: 1
Modified Time: 1673
Debug: Off
Object Name:
Observers:
none
Pointer: 0000028F883B1040
Container manages memory: true
Size: 4608000
Capacity: 4608000Clearly, this needs to be managed in some way. Here’s what I’ve been doing at the moment. First, I want to make sure that I can use the coordinates system more explicitly. So I want to define a “vector” class for coordinates and dimensions representation, using dataclasses (if you want more on dataclasses and why they’re useful, I recommend ArjanCodes’ video on YouTube on the topic):
from dataclasses import dataclass
from typing import Union

@dataclass
class Vector2D:
    x: Union[int, float]
    y: Union[int, float]

    @property
    def xy(self):
        return self.x, self.y

    @property
    def yx(self):
        return self.y, self.x

coordinates = Vector2D(x=20, y=130)
print(coordinates.xy, coordinates.yx)
(20, 130) (130, 20)Next, I want to make the “navigation” in the WSI more transparent. For that, I’ll wrap the OpenSlide class into a WholeSlide class. There are several “helper” functions that I want to add there:
class WholeSlide:
    def __init__(self, path: str):
        self.path = path
        self.slide = openslide.OpenSlide(path)

        if openslide.PROPERTY_NAME_OBJECTIVE_POWER in self.slide.properties:
            self.mag = float(self.slide.properties[openslide.PROPERTY_NAME_OBJECTIVE_POWER])
        else:
            self.mag = 1

        if openslide.PROPERTY_NAME_MPP_X in self.slide.properties \
                and openslide.PROPERTY_NAME_MPP_Y in self.slide.properties:
            self.mpp = Vector2D(x=float(self.slide.properties[openslide.PROPERTY_NAME_MPP_X]),
                                y=float(self.slide.properties[openslide.PROPERTY_NAME_MPP_Y]))
        else:
            self.mpp = Vector2D(x=1., y=1.)

        self.dimensions = Vector2D(x=self.slide.level_dimensions[0][0], y=self.slide.level_dimensions[0][1])

    def get_best_level_for_magnification(self, magnification: float):
        return self.slide.get_best_level_for_downsample(self.mag/magnification)

    def get_absolute_position(self, location: Vector2D):
        """Returns location in µm from the top-left corner"""
        return Vector2D(x=location.x*self.dimensions.x*self.mpp.x,
                        y=location.y*self.dimensions.y*self.mpp.y)

    def read_region(self, location: Vector2D, magnification: float, dimensions: Vector2D):
        level = self.get_best_level_for_magnification(magnification)
        dimensions_at_level = Vector2D(x=int(dimensions.x*self.slide.level_dimensions[level][0]),
                                       y=int(dimensions.y*self.slide.level_dimensions[level][1]))

        location_abs = Vector2D(x=int(location.x*self.dimensions.x), y=int(location.y*self.dimensions.y))

        # check if we need to further rescale to get to the target magnification or if we can use the level as is
        if self.slide.level_downsamples[level] == self.mag/magnification:
            return self.slide.read_region(location_abs.xy, level, dimensions_at_level.xy)

        print(f"Resizing from {self.mag/self.slide.level_downsamples[level]}x")
        region = self.slide.read_region(location_abs.xy, level, dimensions_at_level.xy)
        factor = self.slide.level_downsamples[level]/(self.mag/magnification)
        target_dimensions = Vector2D(x=int(dimensions_at_level.x*factor), y=int(dimensions_at_level.y*factor))
        return region.resize(target_dimensions.xy)
Let’s check that we can get the full image, and the same region at different scales using our relative coordinates:
wsi = WholeSlide("path/to/slide.ndpi")Full image:
plt.figure()
plt.imshow(wsi.read_region(location=Vector2D(0, 0), magnification=20/128, dimensions=Vector2D(x=1, y=1)))
plt.show()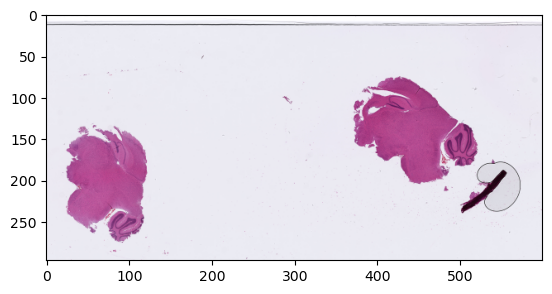
Region @1.25x, 1x, 2.5x
region_location = Vector2D(x=0.015, y=0.43)
region_dimensions = Vector2D(x=0.2, y=0.5)

print(f"Loaction={wsi.get_absolute_position(region_location)}")

plt.figure(figsize=(18,7))
plt.subplot(1, 3, 1)
plt.imshow(wsi.read_region(location=region_location, magnification=1.25, dimensions=region_dimensions))
plt.subplot(1, 3, 2)
plt.imshow(wsi.read_region(location=region_location, magnification=1., dimensions=region_dimensions))
plt.subplot(1, 3, 3)
plt.imshow(wsi.read_region(location=region_location, magnification=2.5, dimensions=region_dimensions))
plt.show()
Loaction=Vector2D(x=528.8527750998485, y=7505.109958220467)
Resizing from 1.25x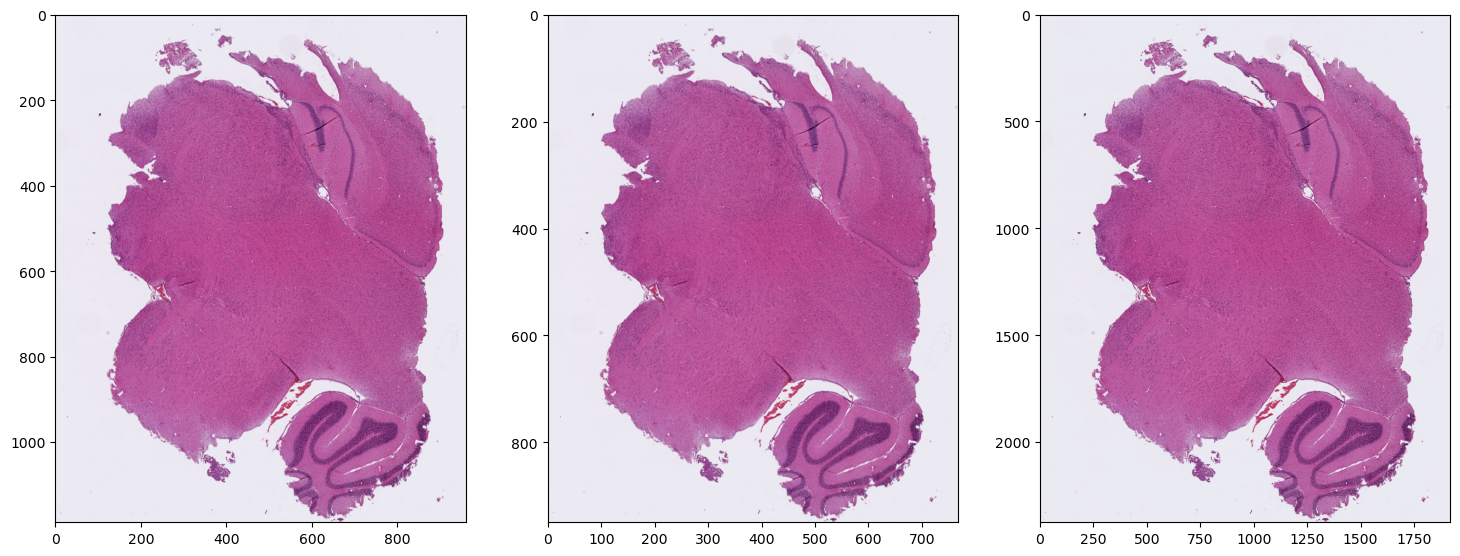
That’s already a lot more convenient. Now we still have to deal with the multi-library situation. What I really want is to make sure that, when I extract a region, I can keep all the relevant information (offset, magnification) along the way, and I can get the image in any format I want. So for that I’m going to create a “SlideRegion” class, and move the read_region code here into a _load method. I’ll also add as_pil, as_np and as_sitk methods to get the images in the requested formats.
class SlideRegion:
    def __init__(self, *,
                 wsi: WholeSlide,
                 location: Vector2D,
                 dimensions: Vector2D,
                 magnification: float):
        self.wsi = wsi
        self.location = location
        self.dimensions = dimensions
        self.magnification = magnification
        self.pil = None

    def _load(self):
        level = self.wsi.get_best_level_for_magnification(self.magnification)
        dimensions_at_level = Vector2D(x=int(self.dimensions.x*self.wsi.slide.level_dimensions[level][0]),
                                       y=int(self.dimensions.y*self.wsi.slide.level_dimensions[level][1]))

        location_abs = Vector2D(x=int(self.location.x*self.wsi.dimensions.x),
                                y=int(self.location.y*self.wsi.dimensions.y))

        # check if we need to further rescale to get to the target magnification or if we can use the level as is
        if self.wsi.slide.level_downsamples[level] == self.wsi.mag/self.magnification:
            self.pil = self.wsi.slide.read_region(location_abs.xy, level, dimensions_at_level.xy)
            return

        print(f"Resizing from {self.wsi.mag/self.wsi.slide.level_downsamples[level]}x")
        region = self.wsi.slide.read_region(location_abs.xy, level, dimensions_at_level.xy)
        factor = self.wsi.slide.level_downsamples[level]/(self.wsi.mag/self.magnification)
        target_dimensions = Vector2D(x=int(dimensions_at_level.x*factor), y=int(dimensions_at_level.y*factor))
        self.pil = region.resize(target_dimensions.xy)

    def as_pil(self):
        if self.pil is None:
            self._load()
        return self.pil

    def as_np(self):
        if self.pil is None:
            self._load()
        return np.array(self.pil)

    def as_sitk(self, floating = False):
        """Floating parameters indicates if the spacing / offset should be set (if floating is False)."""
        if self.pil is None:
            self._load()

        image = sitk.GetImageFromArray(np.array(self.pil), isVector=True)

        if not floating:
            downsample = self.wsi.mag/self.magnification
            spacing = Vector2D(x=float(self.wsi.mpp.x) * downsample,
                               y=float(self.wsi.mpp.y) * downsample)
            origin = self.wsi.get_absolute_position(self.location)

            image.SetSpacing((spacing.x, spacing.y))

            image.SetOrigin((origin.x, origin.y))

        return image

    def absolute_position(self):
        return self.wsi.get_absolute_position(self.location)
And we can now modify the WholeSlide class so that read_region returns a SlideRegion:
class WholeSlide:
    ...

    def read_region(self, location: Vector2D, magnification: float, dimensions: Vector2D):
        return SlideRegion(wsi=self, location=location, magnification=magnification, dimensions=dimensions)
So now we can get our region in the format that we want, while keeping the relevant information:
wsi = WholeSlide("path/to/slide.ndpi")

region_location = Vector2D(x=0.015, y=0.43)
region_dimensions = Vector2D(x=0.2, y=0.5)

region = wsi.read_region(location=region_location, dimensions=region_dimensions, magnification=1.25)
pos = region.absolute_position()
plt.figure()
plt.imshow(region.as_np())
plt.title(f"Location=(x={pos.x:.2f},y={pos.y:.2f})µm @{region.magnification}x")
plt.show()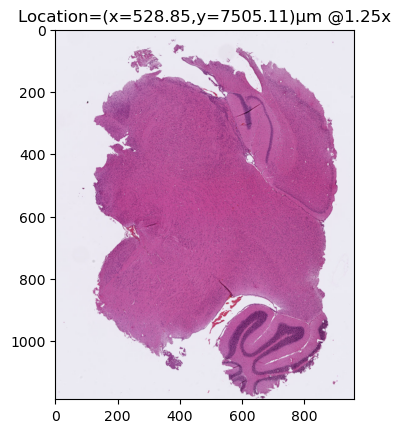
We can check that if we get sitk images at different resolutions, we have the correct information about their origin & spacing:
region_sitk = region.as_sitk()
print(region_sitk.GetOrigin(), region_sitk.GetSpacing())
region_lowres = wsi.read_region(location=region_location, dimensions=region_dimensions, magnification=0.05).as_sitk()
print(region_lowres.GetOrigin(), region_lowres.GetSpacing())
(528.8527750998485, 7505.109958220467) (7.34517743194234, 7.345851889261283)
Resizing from 0.15625x
(528.8527750998485, 7505.109958220467) (183.62943579855852, 183.64629723153206)This should make it a lot less likely for me to screw up in the future !