Fifty shades of U-Net
Adrien Foucart, PhD in biomedical engineering.
This website is guaranteed 100% human-written, ad-free and tracker-free. Follow updates using the RSS Feed or by following me on Mastodon
Adrien Foucart, PhD in biomedical engineering.
This website is guaranteed 100% human-written, ad-free and tracker-free. Follow updates using the RSS Feed or by following me on Mastodon
Poster sessions in conferences are an exercise that I generally dislike. If you've never seen one, the principle is fairly simple: you take the largest halls and corridors at your disposal in the conference center, give each researcher a one meter wide space to hang a poster, and for one hour they stay next to their poster waiting for someone to come and ask questions about it instead of going for another coffee or biscuit (or sandwich, in the particularly bad cases where the poster session happens during lunch break).
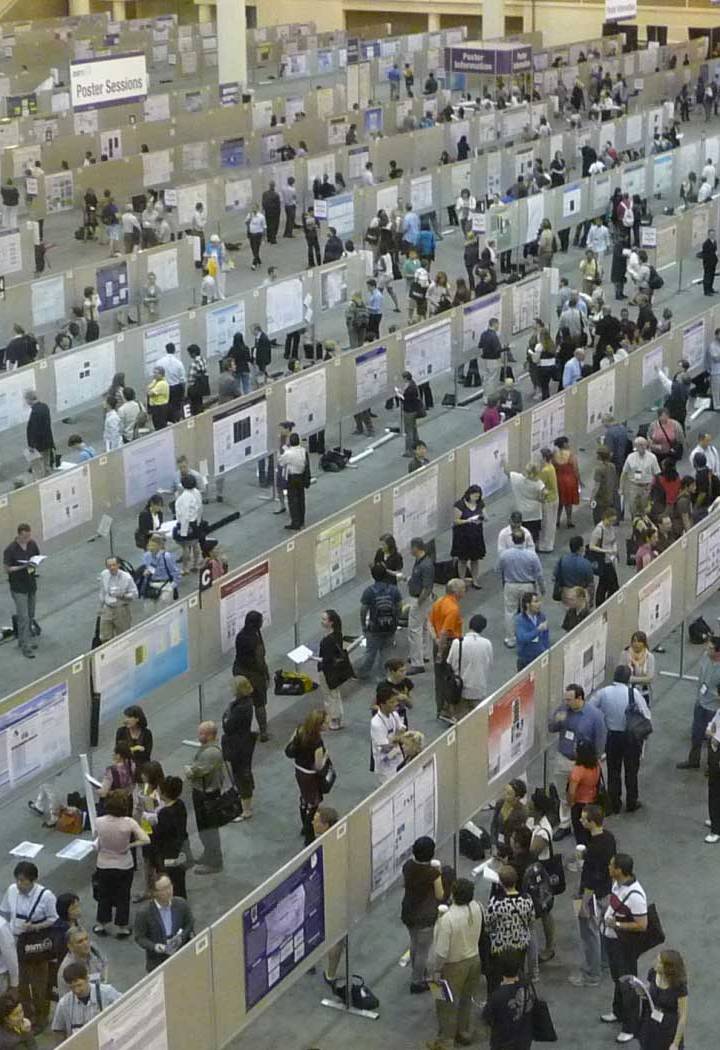
While I think it's generally ineficient as a way of presenting your research, it does provide an unique opportunity of getting a quick overview of "what's going on" in the field. By quickly browsing the posters, which are generally arranged somewhat thematically, you get a sense of the main trends of the domain at the time.
In April 2019, when I attended the ISBI conference, it felt like everywhere we looked we could see the same picture looking back at us:
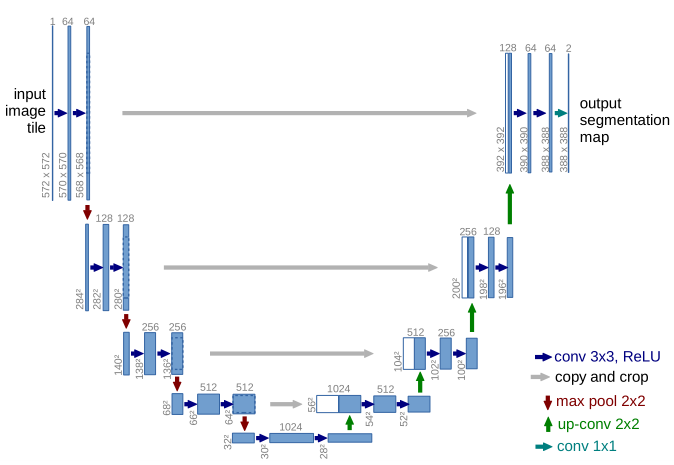
U-Net. It was introduced in 2015 at another conference (MICCAI) and quickly became a very popular choice for medical image segmentation. The two reasons for that were that it got good results on several different challenges and datasets, and that the authors released the trained network and the source code of the model, so anyone who wanted to try it out didn't have to re-implement everything.
By 2019, U-Net was everywhere. It quickly became the default option for medical image segmentation, along with several extensions and adaptations. From the ISBI poster session, it seemed like any segmentation problem could now be approached in the same way: get a bunch of annotations, fit a U-Net on your dataset, publish the results.
The problem of course is: what are we learning from all that? What's the point? Have we just solved segmentation and that's it?
One interaction I had during this poster session stuck with me. I was looking at a table of results on X-Ray images, which used the Dice (or F1) score as a metric. The results were very close to each other, and when I wondered if they thought it was a significant difference, they replied that even though the scores were very similar, they could see a clear difference visually on the shape of the borders of the object, which is what they were mostly interested in. Why, then, didn't they use another, more relevant metric? They apparently hadn't thought about it.
This stuck with me because it's not an isolated case. The F1/Dice score is by far the most widely used metric in segmentation problems, even for problem where we know it's not really good. Why? Because it's familiar, and if we all use the same metrics all the time it's easier to compare things together. But that means that we are now pursuing tiny improvements on metrics which aren't necessarily related to the clinical task that we are actually trying to solve.
An important feature of digital pathology tasks is that they are often difficult to quantify. Pathologists will typically integrate different observations from different images, along with clinical information about the patient, in order to produce their diagnosis. These assessment, however, are often subjective. That's part of the reason we want more computational methods to help with these tasks: to provide more objectivity. But we are now facing a very difficult problem to measure how "good" an algorithm is.
Let's take a quick example and go back to the mitosis detection challenge we talked about earlier. Mitosis detection is not a "pathology" task by itself. It's used, for instance, as part of the Nottingham system for breast cancer classification, alongside other factors. When assessing how good an algorithm is, the question we should be answering is: does it make errors which would lead to a bad diagnostic? And as soon as we get into that, we make the problem a lot more complex, because not only is that extremely hard to measure (as we can only do that on retrospective studies where we know the clinical outcome), but it only leads to more questions, such as: should we penalize more an underestimation of the cancer severity, or an overestimation? Do we prefer an algorithm that's closer to the reality "on average", or an algorithm which has very few outliers?
With all these criteria, the question of "which algorithm is the best" becomes impossible to answer. So we simplify the problem. Instead of asking "which algorithm leads to a better diagnosis", we ask "which algorithm detects the same mitosis as the expert who annotated the images in the dataset", which may lead to a radically different answer.
This is what I want to focus on in my thesis (and here in the next posts): how do we correctly take into account the imperfect nature of digital pathology annotations when we train and test deep learning algorithms? How do we take into account mistakes, imprecisions, and inter-expert disagreement? In short: how do we ensure that we don't use up all our energy chasing for results which don't actually teach us anything either about pathology, or about Deep Learning?