MITOS12: learning from bad challenge design
Adrien Foucart, PhD in biomedical engineering.
This website is guaranteed 100% human-written, ad-free and tracker-free. Follow updates using the RSS Feed or by following me on Mastodon
Adrien Foucart, PhD in biomedical engineering.
This website is guaranteed 100% human-written, ad-free and tracker-free. Follow updates using the RSS Feed or by following me on Mastodon
The ICPR 2012 mitosis detection competition - usually called MITOS12 - proved that Deep Learning was the way to go for mitosis detection, and was influential in introducing Deep Learning into the world of Digital Pathology. It was also a flawed challenge, and there is a lot to learn from the mistakes that were made in its design. To understand those mistakes, we first need to look at what the goal of a "computer vision challenge" is.
Let's say you are a researcher who just developped a new algorithm for recognizing the species of a bird from a photograph in a natural setting. Now, you want to publish your research. In order to convince reviewers that your algorithm is interesting, however, you not only have to prove that it works, but you also have to prove that it improves on the current state-of-the-art.
If you are not a big fan of ethics, here's what you do: you find a set of test images where your algorithm works really, really well. Then, you implement other algorithm, but without caring too much if you do it exactly right. You test all algorithms on your test set and, surprise, you are the best! This may be very helpful in getting published, but of course it also doesn't tell us anything useful.
This is of course an exageration... but not so far from the truth. Even if you do care for ethics, it's very hard to implement other people's methods - especially if they didn't publish the code - and to find the best parameters for every method on your dataset. A very popular way to solve this problem is to use benchmarks and challenges.
The idea of the benchmark is fairly simple. Let's take our "bird recognition" problem: at one point in time, someone publishes a large collection of annotated bird images. Everyone who works on the problem of "bird recognition" can test their algorithm on the same data, which means that you can directly compare your method to what others have published. Challenges are similar, except that there is usually a "time limit" component: someone publishes a bird dataset, and tell everyone interested to submit their method before a given date. Then, everyone is evaluated at the same time (ideally on previously unreleased test images), and the results are published. This ensures a certain fairness in the comparison, as everyone plays by the same rules.
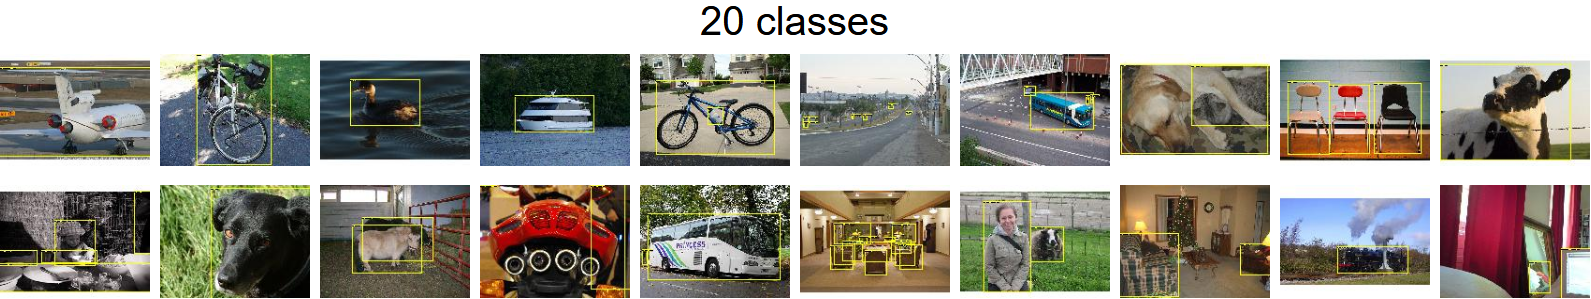
While many challenges only attract a few participants and are quickly forgotten, some have become true references by the computer vision community. The PASCAL Visual Object Classes challenge, for instance, ran between 2005 and 2012, with researchers tasked with recognizing objects from up to 20 different classes (see figure below). Starting in 2010, the ImageNet Large Scale Visual Recognition Challenge (ILSVRC, often simply referred to as "ImageNet") has become the reference for "generic computer vision task".
Many Deep Learning algorithms have become famous through their ImageNet performances, such as the previously mentioned AlexNet [1] (winner in 2012), Google's "Inception" network [2] (winner in 2014), or Microsoft's "ResNet" [3] (winner in 2015).
Challenges entered the world of digital pathology around 2012. Quoting Geert Litjens (emphasis mine):
The introduction of grand challenges in digital pathology has fostered the development of computerized digital pathology techniques. The challenges that evaluated existing and new approaches for analysis of digital pathology images are: EM segmentation challenge 2012 for the 2D segmentation of neuronal processes, mitosis detection challenges in ICPR 2012 and AMIDA 2013, GLAS for gland segmentation and, CAMELYON16 and TUPAC for processing breast cancer tissue samples.
MITOS12 [5] was one of the first computer vision contest with a specific digital pathology task. Let's take a closer look at it.
First of all, why do we want to count mitosis? I'll let the experts explain (emphasis mine):
Mitotic count is an important parameter in breast cancer grading as it gives an evaluation of the aggressiveness of the tumor. However, consistency, reproducibility and agreement on mitotic count for the same slide can vary largely among pathologists. An automatic tool for this task may help for reaching a better consistency, and at the same time reducing the burden of this demanding task for pathologists.
The following process was used to create the challenge:
The MITOS12 results were computed separately on the images from the three different scanners. Most teams only submitted results for the "Aperio" scanner. The best results on that dataset were achieved by Dan Cireşan's team, IDSIA [6]. Their algorithm correctly detected 70 of the 100 mitosis in the test set, with only 9 false detections, for a winning F1 score of 0.7821, the runner-ups achieving scores of 0.7184 and 0.7094.
There are numerous problems with the challenge design, which were actually acknowledged by the authors in this paragraph from the Discussion of their article:
An improved version of this successful challenge will involve a much larger number of mitosis, images from more slides and multiple pathologists’ collaborative/cooperative annotations. Besides, some slides will be dedicated to test only without any HPF of these slides included in the training data set.
There are four different issues here, so let's take them one at a time.
1) The small number of mitosis, with only around 200 mitosis in the training set, is certainly a problem. As mitosis can have a very variable appearance, it is unlikely that all of the possible "morphologies" of mitotic cells will be represented in the dataset. Machine Learning algorithm will therefore not be able to detect them.
2) The small number of slides is even more problematic. More importantly, a small number of slides from a small number of patients. Having more patients mean more diversity, and less risk of a bias in the dataset. For instance, if a patient happens has more mitosis than the others (because she has a more malignant cancer), and also happens to have some independent morphological characteristics in her breast tissue, it is very likely that the algorithm will pick up those independent features and use them to predict the presence of mitotic cells, even if those features would be completely meaningless for other patients.
3) The fact that only one pathologist annotated the slides is also worrying. In the introduction to the challenge, they list as a reason for needing automatic counting the lack of inter-pathologist agreement on mitotic count, citing a study by Christopher Malon and his colleagues [7]. In that study, three different pathologists were asked to classify 4204 nuclei as mitotic or non-mitotic. Pathologists were allowed to put "Maybe" as an answer. Even excluding those "maybe" from the comparison (and therefore comparing only cases where both pathologists were "reasonably certain" of their choice), the agreement between two pathologists was at most 93.5% of "same classification", and in the worst case at 64.7%. That same study also compares each pathologist against the "majority label". The F1 score of a pathologist against the majority, using the data from that study, vary between 0.704 and 0.997. In the MITOS12 challenge results, the top 3 teams are all within that range.
Now that doesn't mean that those three teams are necessarily better than, or even as good as pathologists. It's not fair to compare them on different datasets. But the point is, the difference in performance between the top teams in the challenge is small enough that a different annotator might have led to a completely different ranking.
4) The last problem acknowledged by Roux's publication is the worse one, at least in terms of methodology: they didn't split the training set and the test set properly. Ideally, when we test an algorithm, we want to make sure that it is capable of handling new cases. The best way to do that if to have a test set as independent as possible from the training set.
In biomedical images, that typically means: testing on other slides, taken from other patients, if possible taken with another acquisition machine. Changing more variables mean that the results are a lot more meaningfull. The best algorithms would then have to be those that really learned ways to describe the object of interest - in this case the mitosis. In her master thesis in our lab, Elisabeth Gruwé tested the same algorithm using either the "official" training-set / test-set split from the contest, and then using a "correct" split, by putting one patient aside for testing and training on the four others. The results on the official split were close to those of the three winning teams (0.68), the results on the correct split were significantly worse (0.54).
Does the ranking matter? In terms of visibility, probably. The methods proposed by challenge winners tend to be copied, modified, adapted, and become the norm, while runner-ups may be completely ignored... even if their results are functionally equivalent. If we look at the publications of the three MITOS12 winning methods, a certain trend is visible. The winner, Cireşan's team's article [6], was published in the biggest biomedical imagining conference and has been cited more than a thousand times (according to Google Scholar). The runner-up, Humayun Irshad from the University of Grenoble, was published in a good journal [8] and has been cited about 150 times. The third, Ashkan Tashk and a team from Shiraz University of Technology, was published in the proceedings of an obscure iranian conference [9] and cited about 30 times.
Now the rankings are not the only explanation for this difference in visibility, and the number of citation is not a direct reflection of the influence of a paper. Dan Cireşan was part of a well-established research team with Jurgen Schmidhuber, a Deep Learning pioneer. Humayun Irshad's thesis director was Ludovic Roux, the organizer of the challenge, which is kind of a problem of its own, but ensured that he got some visibility in the follow-up articles. Ashkan Tashk and the iranian team certainly didn't have the same recognition beforehand - or after.
Two years later, an extended version of the challenge was proposed at the ICPR 2014 conference, MITOS-ATYPIA 14. It provided more data, and the annotations were made by two different pathologist, with a third one looking at all cases were the first two were in disagreement. The data included a confidence score for each mitosis based on the agreement or disagreement of the pathologists... and it was correctly split at the patient level. In 2016, Hao Chen and his Hong Kong team published their results on both the 2012 and 2014 datasets [10]. On the 2012 dataset, they achieve a F1 score of 0.788, "beating" Cireşan's entry. They also beat all other existing publications on the 2014 dataset... with a score of 0.482. Comparing the two datasets, they say:
One of the most difficult challenges in [the 2014] dataset is the variability of tissue appearance, mostly resulted from the different conditions during the tissue acquisition process. As a result, the dataset is much more challenging than that in 2012 ICPR.
But from a purely machine learning perspective, this doesn't sound quite right. Yes, the increased variability in the test set is more challenging, but the increased variability in the training set should help the algorithms. The huge drop in performance is likely to be in a large part due to the incorrect setup of the 2012 challenge. The 2014 edition, however, attracted a lot less participants, and didn't get the same visibility... probably because the results were, for obvious reasons, a lot worse.